CIBSE Heat Loss (Basic) dialog box Graph tab
Contains controls used to view a graphical report of the results of the CIBSE heat loss calculation conducted using the Basic Model steady state heat loss model.
| Setting | Description |
|---|---|
| Room selector |
Used to view the graphs for individual rooms or total results. Select a room from the list to update the graph. 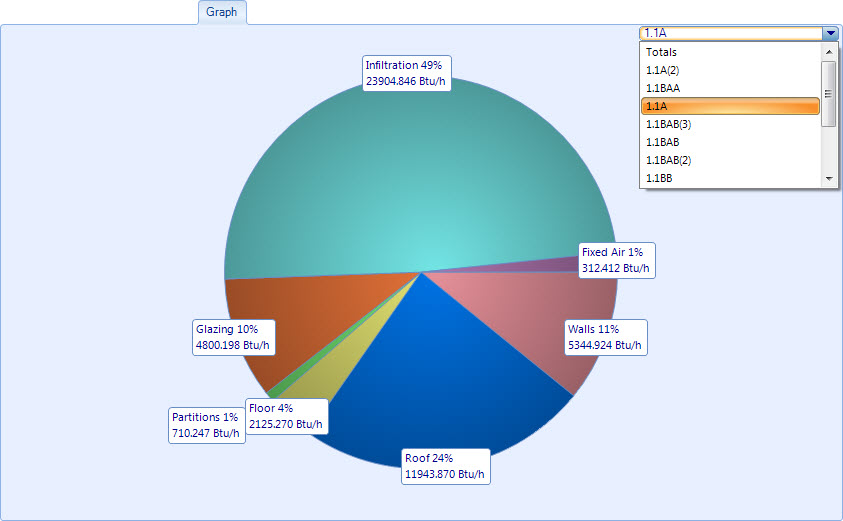 |
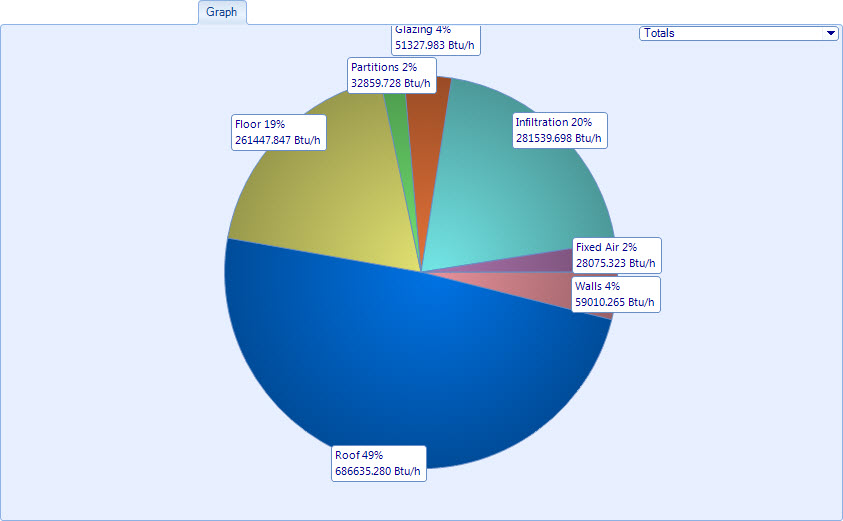
| Graph |
Displays a pie chart graph showing the heat losses for each included room. The pie slices display the percentages for losses from walls, roof, floor, glazing, partitions and infiltration. |